How is Impact Measured?
A scholar’s impact has traditionally been measured via bibliometrics, which include citation impact scores like h-index and i10-index. These indices quantify the number of times someone’s work was cited by others in established databases, such as Google Scholar.
Two broader forms of evaluating the usage and impact of research have emerged in the past decade as an adjunct to traditional citation metrics:
- Article-level metrics (ALMs) provide a wide range of metrics about the uptake of an individual journal article by the scientific community after publication. Starting in 2009, the Public Library of Science (PLoS) introduced ALMs for all articles.
- Altmetrics, proposed in 2010 measure the broader impact of a work such as how many data and knowledge bases refer to it, article views, downloads and mentions in news and social media.
Several services calculate ALM and altmetrics statistics, including Plum Analytics , Altmetric and ImpactStory. Depending on your goals for tracking and disseminating your impact, one or more of these services may be best for you.
Track your Impact Metrics
Track Impact Metrics for Your Published Work
Most published work has a DOI—a persistent interoperable identifier—that is in a system indexed by one of the services that calculated ALMs.
- The subscription form of ImpactStory ($60/year) draws on numerous sources of existing data to compile an overview of your overall impact. The free version draws on your ORCID identifier and Twitter feed to compile a more abbreviated overview of your impact. Here is mine as an example.
- Altmetric tracks more diverse sources and thus provides more granular data about the context in which your work was cited (who, where, how, when etc.) It provides this information at the publication-level rather than at the scholar-level (like ImpactStory)—a task made easier by the Altmetric bookmarklet. So, for example, here is the Altmetric data for one of my recent publications.
- Plum Analytics was acquired by Elsevier and seems more oriented towards selling larger research institutions altmetric data related to comparing researchers and institutions.
Track Impact Metrics for Your Unpublished Work
Unpublished work includes diverse bodies of scholarly work including but not limited to
Educational resources: curricula, lecture slide decks, podcasts, outreach, simulation scripts and other educational modalities.
- Grey literature: this includes online reports not indexed in the National Library of Medicine as well as conference proceedings, quality improvement reports, academic blog posts and other output.
- Community impact: if work you have done—published or not—has impact on the community, this is not always captured by altmetrics sources. This impact includes media coverage, changes to policy and program implementations or improvements.
- Tracking impact not connected to a traditional academic URL database requires more creativity. Although each publication has its own PubMed-indexed URL, other academic output does not.
Create unique URLs for each of your web-based outputs. If there is an existing academic sharing repository for these, use it. Some examples are:
- Medical education materials: MedEdPORTAL
- Other educational resources and grey literature: I use SlideShare to maintain a URL for each non-PubMed output. This includes materials I make “public” such as lecture slides and posters, as well as materials I share on a more limited basis, such as program description documents. Two other repositories for sharing scholarly output are:
- FigShare A repository where users can make all of their research outputs available in a citable, shareable and discoverable manner.
- Zenodo A repository service that enables researchers, scientists, projects and institutions to share and showcase multidisciplinary research results (data and publications) that are not part of existing institutional or subject-based repositories.
To track your metrics for output on these academic sharing repository sites, you can
- Follow metrics on the site.
- Convert each SlideShare URL for each of these outputs into a unique URL that you can track yourself. I use Google URL Shortener because of its great analytics. If you are going this route, use these shortened URLs every timeyou share your content. Follow your use metrics on the Google URL Shortener website.
- The subscription version of ImpactStory tracks SlideShare and figshare.
- If something you do cannot be hosted on an academic sharing repository site, host it somewhere (like Google Docs) and use Google analytics to track its usage metrics.
- On each poster you present at a conference, post the poster on SlideShare and then include a QR code for the poster’s unique URL on the poster itself. There are many free QR code generators online. Here is the QR code of the SlideShare version of a poster:

Amplify your Reach
Social media and blogging can help disseminate the reach of your work. Much has been written about the downsides of social media, including its association with negative mood, wasted time, loss of privacy and identity theft. If your institution has social media amplification resources—accounts that promote the work of faculty—this is a win-win, as it can amplify your work without the personal risk to you. The downside of this is that the university accounts own your metrics—although you can work around some of this via the “Track your Metrics” hacks above.
If you are on social media, promote your own content (using your unique URLs) and the hashtags that get the most reach in your area. To identify the hashtags that are trending, consider searching the Healthcare Hashtag Project. Conference hashtags like #PAS17 are often promoted by the meeting organizer and are a good way of boosting your reach.
I also recommend this compendium of resources for social media use in academic medicine.
Present your Metrics
In academic medicine, we present the impact of our work both intramurally—in our annual reviews and promotions portfolios—and extramurally, in our NIH Biosketches, personal webpages and other venues. You can also include a link to the ImpactStory or Altmetric details relevant to your cited impact metrics to support your statements.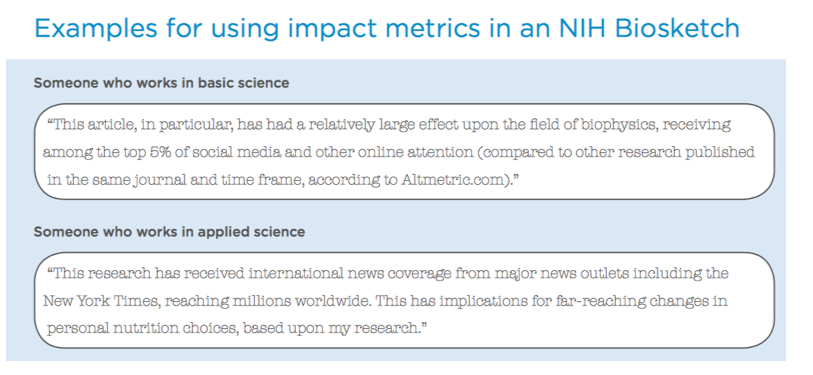
Networking Sites
There are numerous sites to post an online compilation of your work; many will do some of the work for you.
- NCBI will import your PubMed-indexed citations into “My Bibliography”, and then generates a sharable URL for this bibliography. It’s also a useful site for storing collections, setting up PubMed searches and managing your SciENcv biosketch generator.
- Google Scholar also allows you to create a profile including all your publications in the Google Scholar database.
- ORCID, mentioned above in relation to ImpactStory, compiles your publications and federal grants in one place, and allows you to enter other professional information. It is used by some publication managers as a login ID.
- ResearchGate allows you to keep up on publications in your field and allows others in academic medicine to follow your output.
- LinkedIn is not tailored to an academic online CV (hard to import publications, for example), but it is used by so many sectors as a networking resource that it is worth being on, if you don’t mind its association with Microsoft.
- Doximity was built as a LinkedIn for physicians, and is more compatible with PubMed and some altmetrics. It is only accessible to physicians.
- Many universities, including mine, host faculty profiles that can be edited by the faculty to some extent. As examples, mine are at:University of Colorado profile, Colorado Clinical and Translational Sciences Institute profile and Children’s Hospital Colorado profile.

Leave a comment